Notebook examples
This page shows complete Mach5 notebook examples for investigation, operational review, and dashboard promotion.
Example: incident review notebook
This notebook combines notes, MQL exploration, SQL aggregation, and a Discover cell for raw evidence.
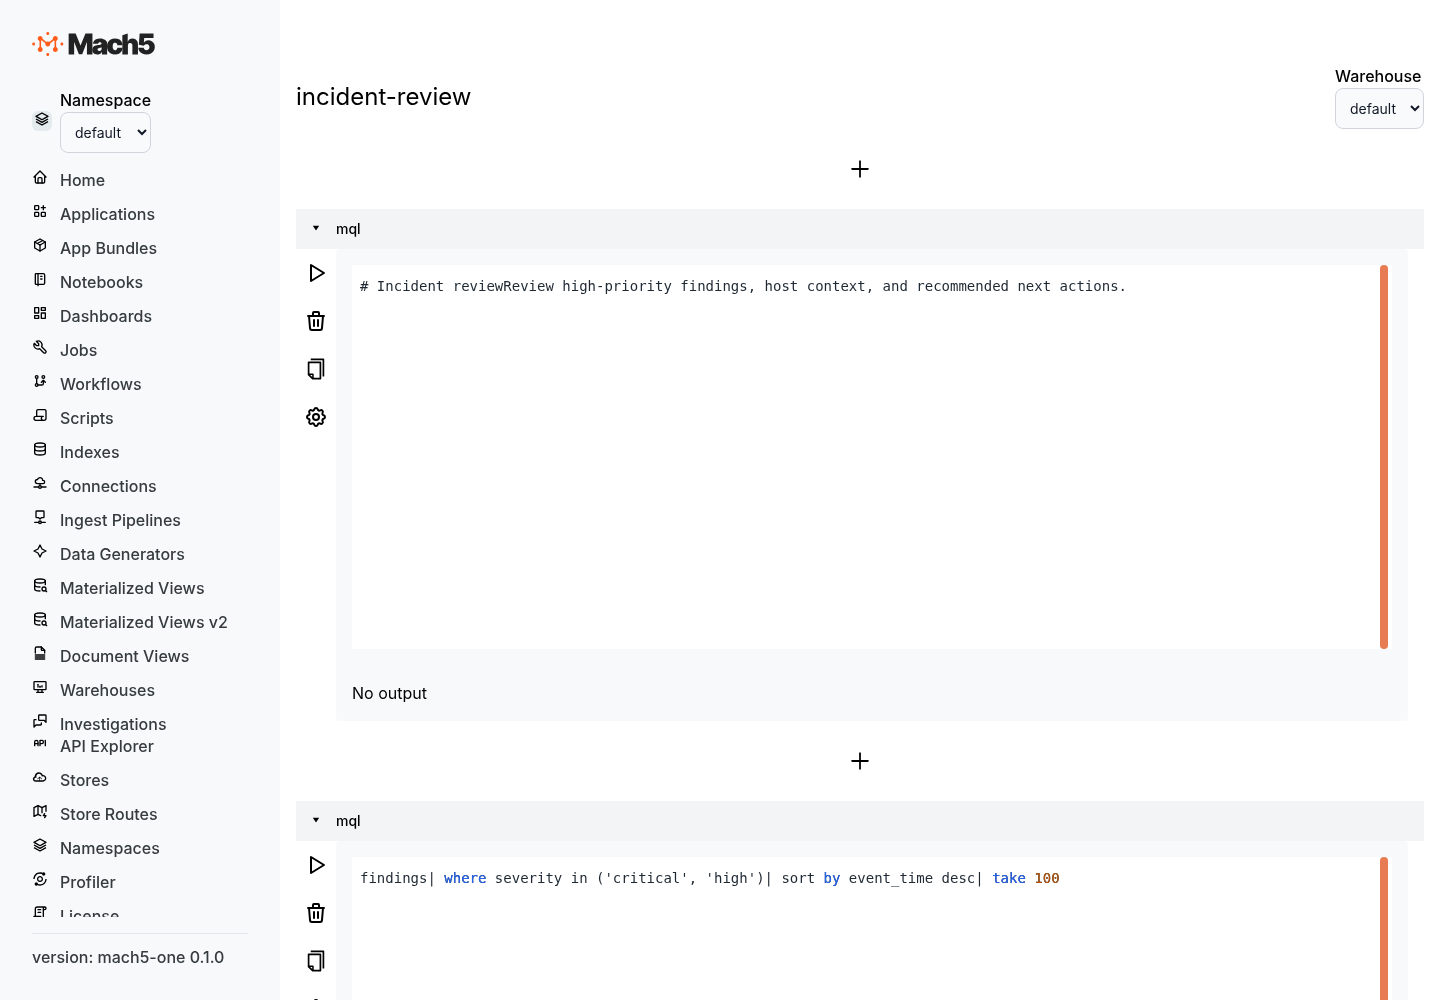
{
  "name": "incident-review",
  "format_version": {
    "major": 1,
    "minor": 0
  },
  "metadata": {
    "title": "Incident review",
    "description": "Investigation notebook for high-risk runtime activity.",
    "tags": ["security", "runtime", "incident"],
    "default_warehouse": "localwarehouse"
  },
  "cells": [
    {
      "id": "note_scope",
      "source": [
        "# Investigation scope",
        "",
        "Review high-risk runtime events from production hosts in the last 24 hours.",
        "Focus on process starts, network connections, user activity, and related findings."
      ],
      "metadata": {
        "type": "markdown",
        "title": "Scope"
      }
    },
    {
      "id": "mql_recent_high_risk_events",
      "source": [
        "runtime_events",
        "| where environment == 'prod'",
        "| where risk_score >= 80",
        "| project event_time, host, user, process_name, command_line, risk_score",
        "| sort by event_time desc",
        "| take 100"
      ],
      "metadata": {
        "type": "mql",
        "title": "Recent high-risk runtime events",
        "warehouse": "localwarehouse"
      }
    },
    {
      "id": "sql_events_by_host",
      "source": [
        "SELECT host, COUNT(*) AS event_count, MAX(risk_score) AS max_risk",
        "FROM runtime_events",
        "WHERE environment = 'prod' AND risk_score >= 80",
        "GROUP BY host",
        "ORDER BY max_risk DESC, event_count DESC",
        "LIMIT 25"
      ],
      "metadata": {
        "type": "sql",
        "title": "High-risk events by host",
        "warehouse": "localwarehouse",
        "visualization": {
          "type": "ranked_list",
          "columns": ["host", "event_count", "max_risk"],
          "value_column": "event_count"
        }
      }
    },
    {
      "id": "discover_runtime_events",
      "source": [],
      "metadata": {
        "type": "discover",
        "title": "Raw runtime evidence",
        "index": "runtime_events",
        "time_field": "event_time",
        "hits_size": 100,
        "enable_chunked": true,
        "filters": [
          {
            "range": {
              "risk_score": {
                "gte": 80
              }
            }
          },
          {
            "match_phrase": {
              "environment": "prod"
            }
          }
        ]
      }
    }
  ]
}
Example: MQL exploration cells
Projection
runtime_events
| project event_time, host, user, process_name, command_line
| take 100
Filtering
runtime_events
| where host == 'ip-10-0-12-34'
| where event_type == 'process_start'
| project event_time, user, process_name, command_line
| sort by event_time desc
Aggregation
runtime_events
| where event_type == 'network_connection'
| summarize connections = count() by destination_ip, destination_port
| sort by connections desc
| take 50
Visualization
findings
| summarize count = count() by severity
| render piechart
runtime_events
| summarize count = count() by bin(event_time, 1h), event_type
| render timechart
Example: SQL cells
Join findings with host context
SELECT
  f.finding_id,
  f.severity,
  f.summary,
  h.host,
  h.owner_team,
  h.environment
FROM findings f
JOIN host_inventory h ON f.host = h.host
WHERE f.severity IN ('critical', 'high')
ORDER BY f.event_time DESC
LIMIT 100;
Notebook cell JSON:
{
  "id": "sql_findings_with_host_context",
  "source": [
    "SELECT f.finding_id, f.severity, f.summary, h.host, h.owner_team, h.environment",
    "FROM findings f",
    "JOIN host_inventory h ON f.host = h.host",
    "WHERE f.severity IN ('critical', 'high')",
    "ORDER BY f.event_time DESC",
    "LIMIT 100"
  ],
  "metadata": {
    "type": "sql",
    "title": "Findings with host context",
    "warehouse": "localwarehouse"
  }
}
Build a dashboard-ready rollup
SELECT
  date_trunc('hour', event_time) AS hour,
  severity,
  COUNT(*) AS finding_count
FROM findings
WHERE event_time >= now() - interval '7 days'
GROUP BY hour, severity
ORDER BY hour;
{
  "id": "sql_findings_rollup",
  "source": [
    "SELECT date_trunc('hour', event_time) AS hour, severity, COUNT(*) AS finding_count",
    "FROM findings",
    "WHERE event_time >= now() - interval '7 days'",
    "GROUP BY hour, severity",
    "ORDER BY hour"
  ],
  "metadata": {
    "type": "sql",
    "title": "Findings rollup",
    "visualization": {
      "type": "time_chart",
      "group_by": "severity",
      "value_column": "finding_count",
      "show_legend": true
    }
  }
}
Example: Discover cell filters
Discover filters use OpenSearch-compatible query objects.
{
  "id": "discover_prod_errors",
  "source": [],
  "metadata": {
    "type": "discover",
    "title": "Production errors",
    "index": "application_logs",
    "time_field": "timestamp",
    "hits_size": 250,
    "enable_chunked": true,
    "filters": [
      {
        "match_phrase": {
          "environment": "prod"
        }
      },
      {
        "match_phrase": {
          "level": "error"
        }
      },
      {
        "range": {
          "timestamp": {
            "gte": "now-24h",
            "lte": "now"
          }
        }
      }
    ]
  }
}
Example: promote notebook analysis to a dashboard panel
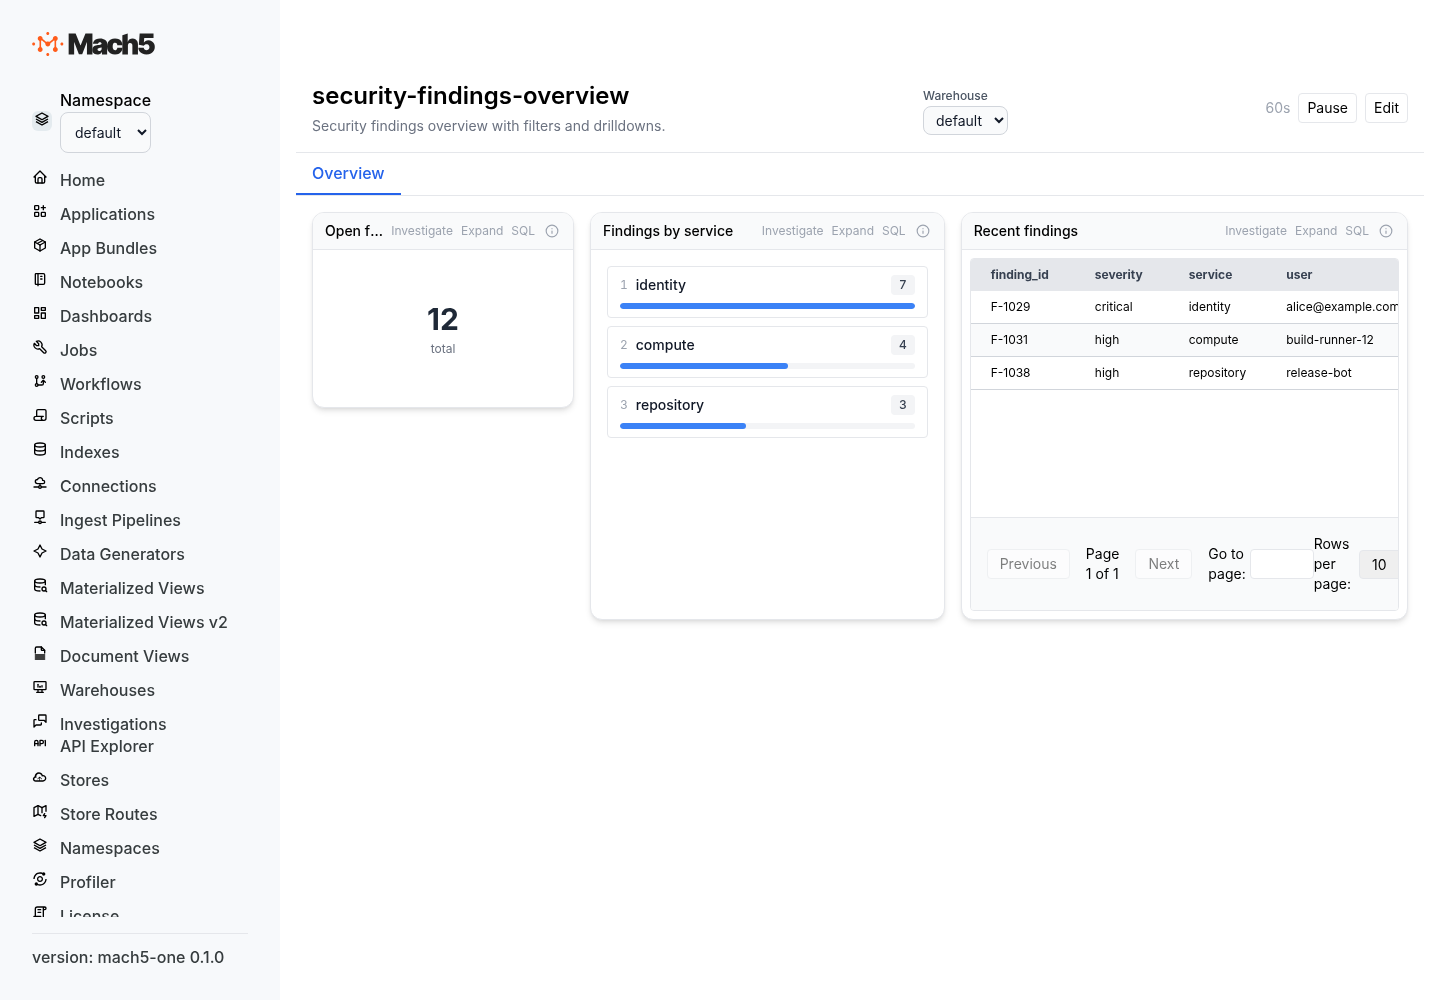
A dashboard panel can reuse a notebook cell result.
{
  "id": "p_findings_rollup_from_notebook",
  "title": "Findings rollup",
  "grid_pos": {
    "x": 0,
    "y": 0,
    "w": 18,
    "h": 8
  },
  "query": {
    "source": {
      "type": "notebook_cell",
      "notebook_name": "incident-review",
      "cell_index": 4
    }
  },
  "visualization": {
    "type": "time_chart",
    "config": {
      "group_by": "severity",
      "value_column": "finding_count",
      "show_legend": true
    }
  }
}
Use this pattern when an exploratory query becomes a dashboard-worthy view.
Example: notebook for connector investigation
This notebook reviews GitHub activity after ingesting GitHub audit events.
{
  "name": "github-activity-review",
  "format_version": { "major": 1, "minor": 0 },
  "metadata": {
    "title": "GitHub activity review",
    "tags": ["github", "audit", "security"]
  },
  "cells": [
    {
      "id": "github_recent_audit_events",
      "source": [
        "github_audit_log",
        "| where action contains 'repo'",
        "| project created_at, actor, action, repo, org",
        "| sort by created_at desc",
        "| take 100"
      ],
      "metadata": {
        "type": "mql",
        "title": "Recent repository audit events"
      }
    },
    {
      "id": "github_actor_summary",
      "source": [
        "SELECT actor, COUNT(*) AS event_count",
        "FROM github_audit_log",
        "WHERE created_at >= now() - interval '24 hours'",
        "GROUP BY actor",
        "ORDER BY event_count DESC",
        "LIMIT 25"
      ],
      "metadata": {
        "type": "sql",
        "title": "Most active actors",
        "visualization": {
          "type": "ranked_list",
          "columns": ["actor", "event_count"],
          "value_column": "event_count"
        }
      }
    }
  ]
}
Best practices
- Put a short note cell at the top explaining the question the notebook answers.
- Use one query per cell.
- Use MQL for fast search and progressive narrowing.
- Use SQL for joins, rollups, and dashboard-ready outputs.
- Keep Discover cells for raw evidence inspection.
- Add visualization metadata when the result should be read visually.
- Promote repeated analysis into dashboard panels or app resources.