Dashboard configuration
This guide shows how to configure Mach5 dashboards with panels, filters, query bindings, visualizations, and interactions.
Complete example
The following dashboard shows security findings by severity, trends over time, recent evidence, and a service filter. It uses SQL panels and dashboard parameters.
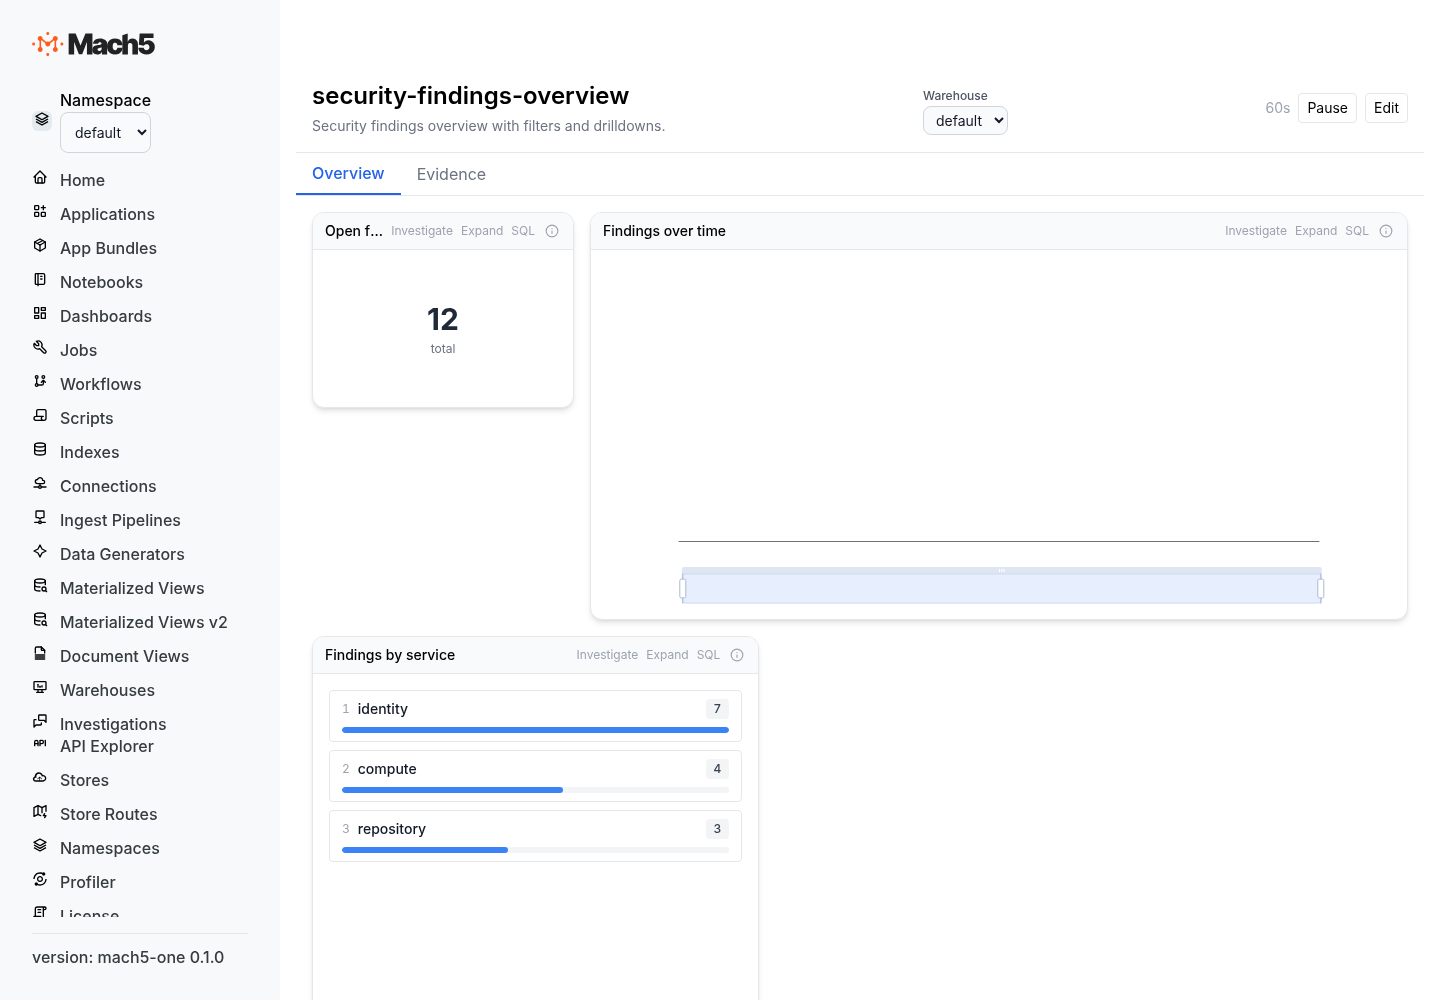
{
  "description": "Security findings overview with filters and drilldowns.",
  "tags": ["security", "findings", "operations"],
  "source": {
    "origin": "manual"
  },
  "refresh": {
    "enabled": true,
    "interval_seconds": 60
  },
  "time_range": {
    "mode": "relative",
    "value": 24,
    "unit": "hours"
  },
  "parameters": [
    {
      "name": "severity",
      "display_name": "Severity",
      "type": "select",
      "default_value": "high",
      "config": {
        "kind": "select",
        "options": [
          { "value": "critical", "label": "Critical" },
          { "value": "high", "label": "High" },
          { "value": "medium", "label": "Medium" },
          { "value": "low", "label": "Low" }
        ]
      }
    },
    {
      "name": "service",
      "display_name": "Service",
      "type": "select",
      "config": {
        "kind": "select",
        "query": {
          "sql": "SELECT DISTINCT service AS value FROM findings ORDER BY service",
          "value_column": "value",
          "label_column": "value",
          "refresh_on_dashboard_open": true
        },
        "allow_custom": true
      }
    }
  ],
  "layout": {
    "columns": 24,
    "row_height": 30,
    "tabs": [
      {
        "name": "Overview",
        "panel_ids": ["p_total", "p_trend", "p_by_service"]
      },
      {
        "name": "Evidence",
        "panel_ids": ["p_recent_findings"]
      }
    ]
  },
  "panels": [
    {
      "id": "p_total",
      "title": "Open findings",
      "description": "Total findings matching the selected severity.",
      "grid_pos": { "x": 0, "y": 0, "w": 6, "h": 4 },
      "query": {
        "source": {
          "type": "sql",
          "sql": "SELECT COUNT(*) AS total FROM findings WHERE severity = {{severity}}"
        },
        "parameter_bindings": [
          { "parameter_name": "severity", "query_placeholder": "{{severity}}" }
        ]
      },
      "visualization": {
        "type": "metric_card",
        "emphasis": "hero",
        "config": { "value_column": "total" }
      }
    },
    {
      "id": "p_trend",
      "title": "Findings over time",
      "grid_pos": { "x": 6, "y": 0, "w": 18, "h": 8 },
      "query": {
        "source": {
          "type": "sql",
          "sql": "SELECT date_trunc('hour', event_time) AS hour, severity, COUNT(*) AS count FROM findings WHERE severity = {{severity}} GROUP BY hour, severity ORDER BY hour"
        },
        "parameter_bindings": [
          { "parameter_name": "severity", "query_placeholder": "{{severity}}" }
        ]
      },
      "visualization": {
        "type": "time_chart",
        "emphasis": "primary",
        "config": {
          "group_by": "severity",
          "value_column": "count",
          "max_series": 5,
          "show_legend": true,
          "stacking": "overlay"
        }
      }
    },
    {
      "id": "p_by_service",
      "title": "Findings by service",
      "grid_pos": { "x": 0, "y": 8, "w": 10, "h": 8 },
      "query": {
        "source": {
          "type": "sql",
          "sql": "SELECT service, COUNT(*) AS count FROM findings WHERE severity = {{severity}} GROUP BY service ORDER BY count DESC LIMIT 10"
        },
        "parameter_bindings": [
          { "parameter_name": "severity", "query_placeholder": "{{severity}}" }
        ]
      },
      "visualization": {
        "type": "ranked_list",
        "config": {
          "columns": ["service", "count"],
          "value_column": "count"
        }
      },
      "interactions": [
        {
          "trigger": { "type": "select", "column": "service" },
          "action": {
            "type": "cross_filter",
            "target_parameter": "service",
            "value_from": "service"
          }
        }
      ]
    },
    {
      "id": "p_recent_findings",
      "title": "Recent findings",
      "grid_pos": { "x": 10, "y": 8, "w": 14, "h": 10 },
      "query": {
        "source": {
          "type": "sql",
          "sql": "SELECT finding_id, event_time, service, user, summary, risk_score FROM findings WHERE severity = {{severity}} ORDER BY event_time DESC LIMIT 100"
        },
        "parameter_bindings": [
          { "parameter_name": "severity", "query_placeholder": "{{severity}}" }
        ],
        "transform": {
          "operations": [
            { "type": "sort", "column": "event_time", "descending": true },
            { "type": "limit", "count": 100 }
          ]
        }
      },
      "visualization": {
        "type": "data_table",
        "emphasis": "detail",
        "config": {
          "columns": ["finding_id", "event_time", "service", "user", "summary", "risk_score"]
        }
      },
      "interactions": [
        {
          "trigger": { "type": "click", "column": "finding_id" },
          "action": {
            "type": "drill_to_investigation",
            "prompt_template": "Investigate finding {{ finding_id }}. Summarize evidence, related entities, likely root cause, and recommended next actions."
          }
        }
      ]
    }
  ]
}
Configure parameters
Parameters are declared once and reused by panels.
Select with static options
{
  "name": "environment",
  "display_name": "Environment",
  "type": "select",
  "default_value": "prod",
  "required": true,
  "config": {
    "kind": "select",
    "options": [
      { "value": "prod", "label": "Production" },
      { "value": "staging", "label": "Staging" },
      { "value": "dev", "label": "Development" }
    ]
  }
}
Multi-select parameter
{
  "name": "teams",
  "display_name": "Teams",
  "type": "multi_select",
  "config": {
    "kind": "select",
    "query": {
      "sql": "SELECT DISTINCT owner_team AS value FROM services ORDER BY owner_team",
      "value_column": "value",
      "label_column": "value",
      "refresh_on_dashboard_open": true
    }
  }
}
Text search parameter
{
  "name": "search_text",
  "display_name": "Search",
  "type": "text",
  "config": {
    "kind": "text",
    "placeholder": "hostname, user, command, trace id..."
  }
}
Numeric threshold parameter
{
  "name": "min_score",
  "display_name": "Minimum score",
  "type": "number",
  "default_value": "80",
  "config": {
    "kind": "number",
    "min": 0,
    "max": 100,
    "step": 5
  }
}
Bind parameters to queries
Use parameter_bindings to map a dashboard parameter to a placeholder in the query text.
{
  "query": {
    "source": {
      "type": "sql",
      "sql": "SELECT * FROM findings WHERE severity = {{severity}} AND risk_score >= {{min_score}}"
    },
    "parameter_bindings": [
      { "parameter_name": "severity", "query_placeholder": "{{severity}}" },
      { "parameter_name": "min_score", "query_placeholder": "{{min_score}}" }
    ]
  }
}
Use a clear placeholder convention and bind every placeholder explicitly.
Configure panels
Every panel needs an id, title, grid_pos, query, and visualization.
{
  "id": "p_errors_by_service",
  "title": "Errors by service",
  "grid_pos": { "x": 0, "y": 0, "w": 12, "h": 8 },
  "query": {
    "source": {
      "type": "sql",
      "sql": "SELECT service, COUNT(*) AS errors FROM logs WHERE level = 'error' GROUP BY service ORDER BY errors DESC LIMIT 10"
    }
  },
  "visualization": {
    "type": "column_chart",
    "config": {
      "group_by": "service",
      "value_column": "errors",
      "show_legend": false
    }
  }
}
Query source examples
SQL panel
{
  "source": {
    "type": "sql",
    "warehouse": "localwarehouse",
    "sql": "SELECT service, COUNT(*) AS requests FROM access_logs GROUP BY service"
  }
}
MQL panel
{
  "source": {
    "type": "mql",
    "warehouse": "localwarehouse",
    "query": "source=access_logs | stats count() by service"
  }
}
OpenSearch-compatible panel
{
  "source": {
    "type": "opensearch",
    "index": "access_logs",
    "body": "{\"size\":0,\"aggs\":{\"by_service\":{\"terms\":{\"field\":\"service.keyword\"}}}}"
  }
}
App query panel
{
  "source": {
    "type": "app_query",
    "app_id": "agent-runtime-attribution",
    "query_name": "recent_agent_runs",
    "parameters": {
      "environment": "prod"
    }
  }
}
Notebook cell panel
{
  "source": {
    "type": "notebook_cell",
    "notebook_name": "incident-review",
    "cell_index": 3
  }
}
Transform panel results
Transforms run after the query and before visualization.
{
  "transform": {
    "operations": [
      { "type": "filter", "column": "risk_score", "op": ">=", "value": "80" },
      { "type": "sort", "column": "risk_score", "descending": true },
      { "type": "limit", "count": 25 }
    ]
  }
}
Supported transform operations:
| Operation | Fields |
|---|---|
filter | column, op, value |
sort | column, descending |
limit | count |
Visualization examples
Metric card
{
  "type": "metric_card",
  "emphasis": "hero",
  "config": {
    "value_column": "total"
  }
}
Time chart
{
  "type": "time_chart",
  "config": {
    "group_by": "service",
    "value_column": "count",
    "max_series": 10,
    "show_legend": true,
    "stacking": "overlay"
  }
}
Data table
{
  "type": "data_table",
  "emphasis": "detail",
  "config": {
    "columns": ["event_time", "service", "host", "message"]
  }
}
Ranked list
{
  "type": "ranked_list",
  "config": {
    "columns": ["user", "count"],
    "value_column": "count"
  }
}
Network graph
{
  "type": "network_graph",
  "config": {
    "columns": ["source_ip", "destination_ip", "bytes"],
    "value_column": "bytes"
  }
}
Timeline
{
  "type": "timeline",
  "config": {
    "columns": ["event_time", "entity", "event_type", "summary"]
  }
}
Configure interactions
Cross-filter another panel
This interaction sets the service dashboard parameter from a selected row.
{
  "trigger": {
    "type": "select",
    "column": "service"
  },
  "action": {
    "type": "cross_filter",
    "target_parameter": "service",
    "value_from": "service"
  }
}
Drill to AI investigation
{
  "trigger": {
    "type": "click",
    "column": "finding_id"
  },
  "action": {
    "type": "drill_to_investigation",
    "prompt_template": "Investigate finding {{ finding_id }}. Include related hosts, users, processes, network flows, and recommended next actions."
  }
}
Navigate to another dashboard
{
  "trigger": {
    "type": "click",
    "column": "service"
  },
  "action": {
    "type": "navigate_to_dashboard",
    "dashboard_name": "service-deep-dive",
    "parameter_mappings": {
      "service": "service",
      "environment": "environment"
    }
  }
}
Open an external URL
{
  "trigger": {
    "type": "click",
    "column": "ticket_id"
  },
  "action": {
    "type": "open_url",
    "url_template": "https://jira.example.com/browse/{{ ticket_id }}"
  }
}
Best practices
- Put high-level metrics at the top and evidence panels below.
- Use dashboard parameters for filters that multiple panels share.
- Keep heavy query logic in materialized views when dashboards need fast refresh.
- Use
refresh_override_secondsfor expensive panels. - Use cross-filtering for exploratory dashboards.
- Use drill-to-investigation for panels that require follow-up reasoning.
- Prefer app queries for packaged, reusable app dashboards.